We Backtested Supertrend on SOL-PERP with $100k. Here Are the Numbers.
Most strategy articles show you a backtest with one set of parameters, a rising equity curve, and a confident conclusion. This is not that. We took a single strategy, Supertrend, pointed it at a single asset, SOL-PERP, gave it a $100,000 account, and ran it on ten months of real LMEX daily data. We modelled the fees, the funding, and the slippage. Then we did the two things most strategy write-ups skip: we swept the parameters to see how fragile the result was, and we ran a walk-forward test to see what you would actually have earned trading it live. The answer is more interesting than a green equity curve.
The setup
The rules are the standard Supertrend. Compute the Average True Range over a lookback period, place a band a multiple of ATR above and below the midpoint, and flip your position when price closes through the band. Long when the trend is up, short when it is down. If you want the full mechanics, our Supertrend strategy guide walks through them. Here we care about what it did with money.
The test parameters:
One number frames everything that follows. Over this window, SOL fell from $238 to $78, a decline of 67%. This was a bear market. Keep that in mind, because it shapes every result and it is the single biggest caveat in this piece.
Baseline: Supertrend(10, 3) versus buy and hold
We start with the textbook default, an ATR period of 10 and a multiplier of 3, trading both long and short. Here is how $100,000 would have travelled.
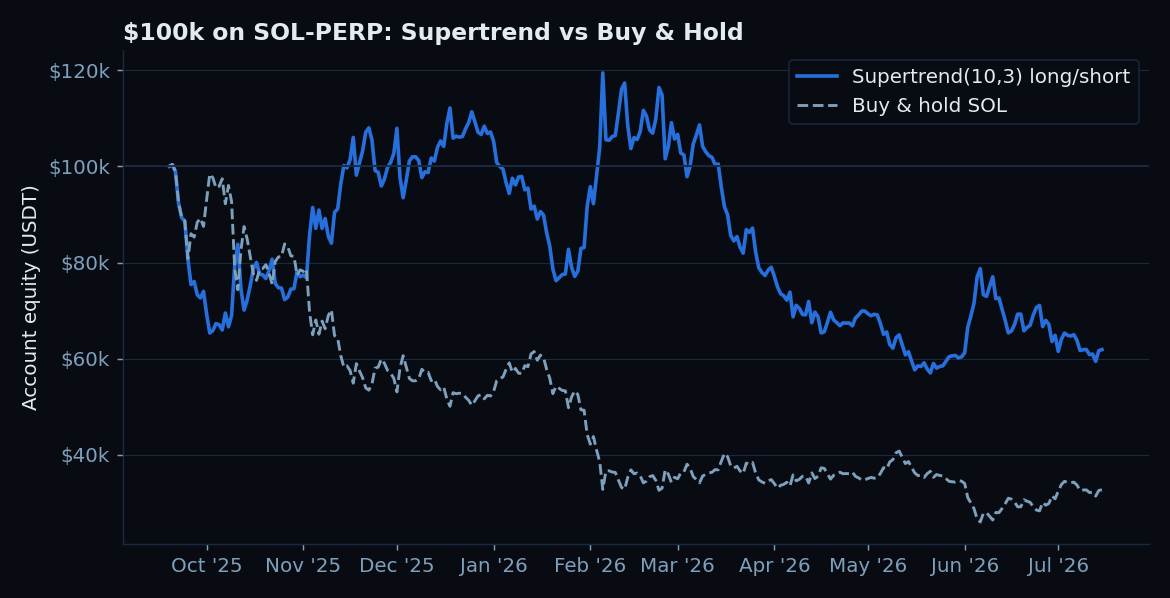
Read that honestly. The strategy lost money. It ended the period down 38%. Anyone who tells you Supertrend is a money printer is not showing you a bear market. What it did do is lose a lot less than holding: $61,912 versus $32,800, and a 52% drawdown instead of 74%. In a year when SOL cut its holders roughly into a third, the trend follower cushioned the fall by being short for part of the decline. That is a real and useful property, but it is loss mitigation, not profit.
Why shorting mattered
Because SOL-PERP is a perpetual, the strategy can go short, and in a downtrend that should help. It did. When we restrict the same strategy to long and flat only, stepping aside instead of shorting, the result is worse across the board.
The long-only version sat in cash 83% of the time and still lost 47%, because the few times it went long were failed rallies inside a downtrend. A profit factor of 0.01 means its winners were almost nonexistent next to its losers. On a perpetual in a bear market, the ability to short is what turned a disaster into a merely bad year.
The drawdown picture
Return numbers hide the emotional reality of a strategy. Drawdown does not. This is how far underwater each approach went at every point.
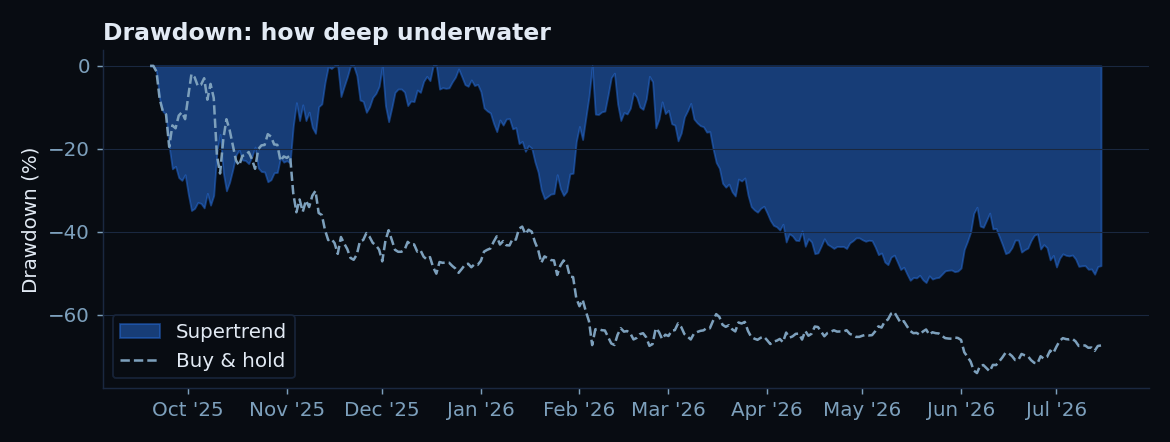
A 52% drawdown is still brutal. If your risk tolerance cannot survive watching $100k become $48k at the low, this strategy at this size is not for you, even though it beat the alternative. The math of drawdown recovery is unforgiving: a 52% loss needs a 108% gain just to get back to even. This is why position sizing and leverage discipline matter more than the entry signal, a point we make in volatility targeting.
Where the money went: costs
A fair backtest has to account for what trading actually costs. Here the news is mild. Supertrend on daily bars is a low-frequency strategy: it made only 9 round trips in 10 months. At 0.04% taker plus 0.02% slippage per side, total trading costs came to roughly 1.1% of the account across the whole period. Funding was a small drag too, the real 8h funding averaged 0.0030%, which longs pay and shorts collect, worth about 3.3% annualised against a constantly-held long.
The honest takeaway: costs did not sink this strategy. The whipsaws did. In a choppy decline with sharp counter-trend rallies, Supertrend repeatedly flipped long near local tops and short near local bottoms. That is a market-structure problem, not a fee problem, and no amount of fee optimisation fixes it.
The part most backtests hide: parameter sensitivity
Here is where a single equity curve becomes dangerous. We ran the same strategy across a grid of ATR periods and multipliers. If the strategy has a real edge, you would expect a broad zone of similar, positive results. Instead:
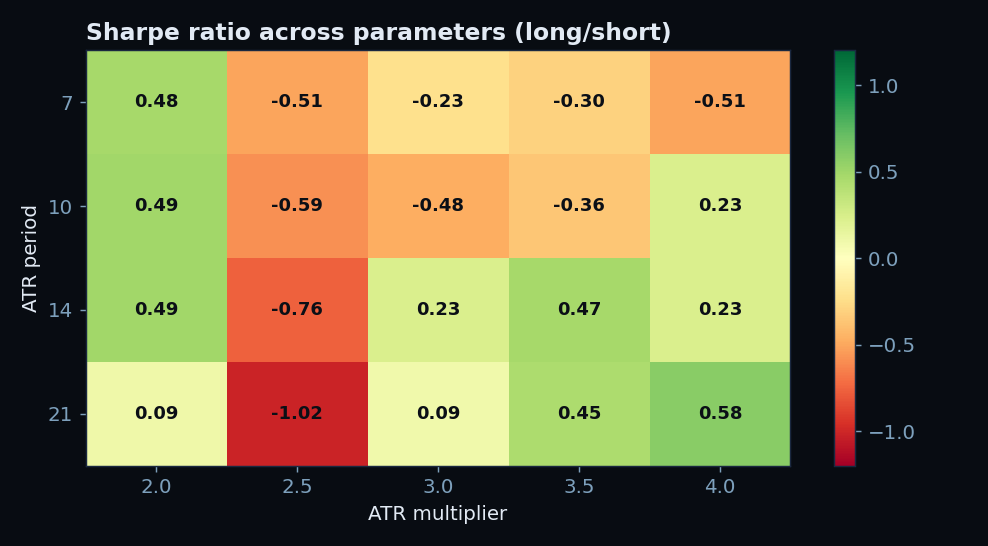
Look at what this says. The default (10, 3) that everyone quotes returned -38%, one of the worst cells in the grid. A multiplier of 2.0 was positive across almost every period. A multiplier of 2.5 was a catastrophe across every period. Nudge the multiplier from 2.0 to 2.5 and you swing from +8% to -42%. That is not a strategy with a stable edge. That is a coin that happened to land a certain way on this specific slice of history.
If we were dishonest, we would title this article "Supertrend(21, 4.0) returned +14% on SOL-PERP" and show you only that cell. It would be true and it would be worthless, because there is no reason to believe 21 and 4.0 will be the winning numbers next year. This is the single most common way backtests lie: they report the best parameter set found in hindsight and call it the strategy.
The honest test: walk-forward
The only way to know what you would have actually earned is to never let the strategy see the future. So we ran a walk-forward. At each step, the strategy looks only at past data, picks the best parameters on that history, then trades the next 40 days blind with those parameters. Then it re-selects and repeats. This is the closest thing to trading it live, and we cover the method in walk-forward optimization.
Two things stand out. First, the out-of-sample result, -13.9%, was better than the fixed default's -38% but still a loss. Ending near $86,000 while buy and hold ended near $33,000 is genuine capital preservation, but it is not a winning system. Second, watch the parameters migrate. The optimiser kept changing its mind, drifting from a fast setting to a slow one as the market's character shifted. A strategy whose best parameters wander that much is telling you it has no stable edge on this asset in this regime. It is adapting to noise.
The verdict
Supertrend on SOL-PERP, over these ten months, was a capital-preservation tool, not a profit engine. It roughly halved the loss of holding and cut the drawdown from 74% to 52%, mostly by being short during a sustained decline. Out of sample it still lost around 14%. And its results were dangerously sensitive to parameters, which is the clearest possible sign that you should not trust any single backtested number from it.
None of this makes Supertrend useless. It makes it honest. Trend following earns its keep in clean, sustained trends, and this period was a choppy grind lower full of violent bear-market rallies, close to the worst environment for it. The same test in a smooth bull market, or with a regime filter that keeps the strategy out during chop, could look very different. That is the next experiment, not the conclusion of this one.
If you take one thing from a $100k, ten-month, fully-costed backtest, let it be this: the equity curve is the least important output. The parameter sensitivity and the walk-forward are what tell you whether the edge is real. Build your own tests to answer those two questions first, and read our guide to backtesting properly before you trust any strategy with real size.
Frequently Asked Questions
Q: Does this mean Supertrend does not work?
It means Supertrend did not profit on SOL-PERP during a choppy 10-month bear market, and that its results were highly parameter-sensitive here. Trend-following strategies are regime-dependent. They tend to work in sustained trends and struggle in choppy or ranging conditions. This test captured a bad regime for it, which is exactly why the capital-preservation result is still notable.
Q: Why not just report the parameters that made money?
Because that is hindsight, and hindsight does not trade. The (21, 4.0) setting returned +14% on this data, but nothing told you in advance that it would be the winner, and the walk-forward shows the best parameters kept changing. Reporting the best in-sample cell is the most common way backtests mislead people.
Q: Would leverage have helped?
No, it would have amplified the loss. Running this at 1x lost 38% on the default parameters; at 3x the drawdown would have approached or exceeded a full wipeout during the -52% peak-to-trough. Leverage multiplies both directions, and on a losing or choppy strategy it accelerates the path to liquidation. Size by risk, not by ambition.
Q: How were fees and funding handled?
We used the real LMEX taker fee of 0.04% per side plus an assumed 0.02% slippage, and applied the actual 8h funding rate history (mean 0.0030% per interval) against held positions. Because the strategy traded only 9 times, costs were a minor factor, about 1.1% total. The losses came from whipsaws, not fees.
Q: Can I trust a 10-month backtest at all?
Only as one data point. Ten months covering a single bear regime is not enough to conclude anything general about the strategy. It is enough to demonstrate a method: model costs honestly, sweep parameters to test fragility, and walk forward to estimate live performance. Apply that method across multiple assets and regimes before drawing conclusions.