MACD vs Supertrend on SOL-PERP: The Same $100k, Two Very Different Outcomes
In our Supertrend deep dive we ran a single trend-following strategy on SOL-PERP with a $100,000 account and found it lost 38% over ten months, cushioning a brutal bear market but never turning a profit. A fair question followed: was that Supertrend's fault, or is trend following itself just broken on this asset in this regime? So we ran a second trend follower, MACD, on the exact same data, the same account, and the same cost model. The two are both "trend-following" strategies. Their results were not remotely similar, and that gap is the whole point of this article.
Same test, different signal
Everything except the entry logic is identical to the Supertrend study, so the comparison is clean.
MACD works differently from Supertrend. Instead of an ATR band, it takes the difference between a fast and a slow exponential moving average, then smooths that difference into a signal line. When the MACD line crosses above its signal, go long; when it crosses below, go short. If you want the mechanics, see our MACD strategy guide. The default is a 12-period fast EMA, 26 slow, and a 9-period signal.
The result: nearly flat in a market that fell 67%
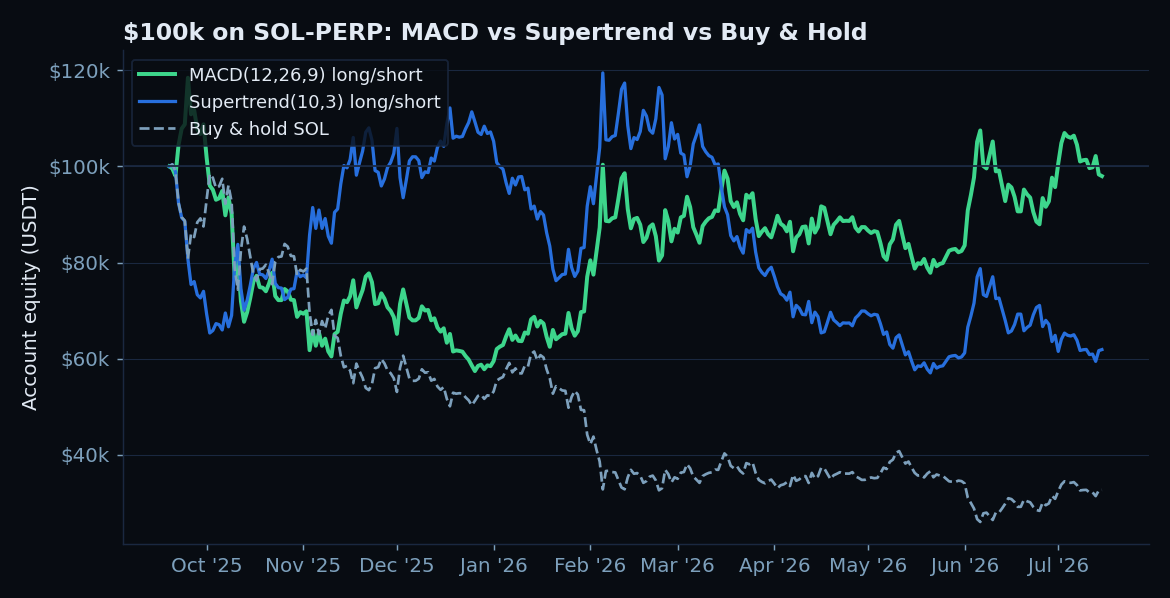
Read the MACD column carefully. Over a period where SOL lost two thirds of its value, MACD(12,26,9) finished down just 2%, ending at $97,973 on a $100,000 account. Its Sharpe was positive, barely, and its profit factor cleared 1.0, meaning its winners outweighed its losers. This is the first configuration in either study to essentially hold its ground through the bear market. Same asset, same period, same costs as Supertrend, and a completely different outcome. The only thing that changed was the signal.
Notice too that the win rate was only 28.6%. MACD was wrong on most of its trades, but it was right on the big ones. That is the signature of trend following working as designed: many small losses paid for by a few large winners, which is exactly what a profit factor above 1 with a sub-30% win rate tells you.
Shorting mattered again
As with Supertrend, restricting MACD to long-and-flat removed most of its value. It could no longer profit from the down-legs, so it fell back toward the market.
The pattern is consistent across both studies: on a perpetual in a downtrend, the ability to go short is what separates a strategy that survives from one that bleeds. If you only trade long, you are betting the market goes up, and no clever signal fixes that in a year when it does the opposite.
Drawdown: still a stomach-churning ride
Before anyone celebrates, look at the drawdown. Ending near breakeven did not mean a smooth path.
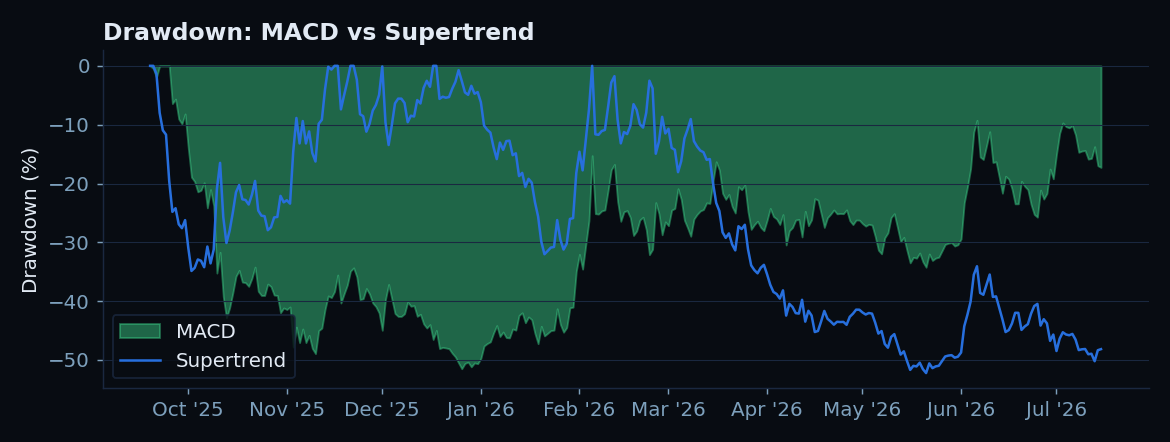
MACD's worst drawdown was 51.5%, essentially the same as Supertrend's. Ending flat after being down more than half is not a comfortable experience, and the math of drawdown recovery still applies: you had to survive watching $100k become roughly $48k before it clawed back. A strategy that finishes flat but halves your account on the way is not obviously better for a real human than one that just loses slowly. Returns and drawdowns are different axes, and both matter.
Parameter sensitivity: a clearer pattern this time
We ran MACD across a grid of fast and slow EMA lengths. Recall that Supertrend's grid was scattered chaos, with good and bad cells sitting randomly side by side. MACD's grid has structure.
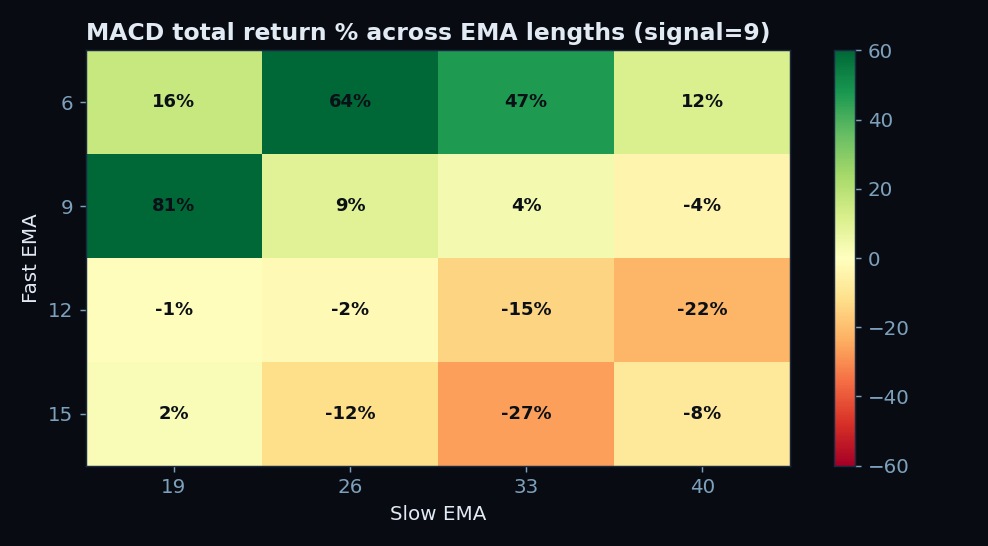
There is a real gradient here. Fast MACD settings (a 6 or 9 period fast EMA) were positive almost everywhere, while slower settings (12 or 15) were mostly negative. That is a more encouraging picture than Supertrend's random scatter, because it suggests the edge is tied to a property, responsiveness, rather than to one lucky cell. On a volatile asset making sharp moves, a faster signal flipped in time to catch them, while a slow signal lagged and got caught wrong-footed.
That said, the range is still enormous, from -27% to +81%. The default (12,26,9) at -2% sits in the weak half of the grid. If you had used the textbook parameters you would have been near flat, while a faster setting would have made real money. Which brings us to the honest test.
Walk-forward: the encouraging part
We ran the same walk-forward as before. At each step the strategy sees only past data, picks the best parameters on that history, then trades the next 40 days blind. This is the closest thing to trading it live, and the method is described in walk-forward optimization.
Two things stand out, and they are exactly the two things Supertrend failed. First, the out-of-sample return was strongly positive, roughly doubling the tested capital with a Sharpe above 2 and a shallower 22% drawdown. Second, and arguably more important, the optimiser chose the same parameters, fast 9 and slow 19, in every single window. Supertrend's best parameters wandered from window to window, a sign it was chasing noise. MACD locked onto one setting and it kept working out of sample. Consistent parameter selection across folds is one of the better signals that an edge is real rather than fitted.
The honest verdict, and the trap
Here is where discipline matters. It is tempting to conclude "MACD beats Supertrend, use MACD." That is the wrong lesson, and it is the same overfitting instinct in a new costume. What this actually shows is narrower and more useful.
The choice of signal dominated the outcome. Two strategies from the same family, trend following, run on identical data with identical costs, produced a 36 percentage point gap in return. That should make you deeply skeptical of any single backtest, including this favourable one. If swapping Supertrend for MACD swings the result that much, then the result is not really about "trend following on SOL," it is about the specific quirks of how each indicator interacted with this exact price path.
MACD's stronger walk-forward and coherent parameter map are genuinely more encouraging than Supertrend's, and if forced to trade one of these on SOL-PERP, the evidence here favours a fast MACD. But this is still one asset over one ten-month bear market. A single positive walk-forward is a data point, not a proven edge. Fast MACD also flips more often, so real-world slippage on a live book could erode the tidy backtest edge, and our 0.06% per-side assumption may be generous for a higher-turnover variant. The only way to trust this is to repeat it across several assets and several market regimes and see if the fast-MACD advantage survives. That is the next experiment.
If you take one thing from running two strategies instead of one, let it be humility about the first. The Supertrend article looked like a verdict on trend following. Put a second signal next to it and you learn it was really a verdict on Supertrend. Always test more than one version of an idea before you believe any of them, and build the backtesting discipline to do it honestly.
Frequently Asked Questions
Q: So MACD is better than Supertrend?
On this one asset over this one 10-month bear market, MACD performed far better, ending near breakeven versus Supertrend's 38% loss, with a stronger walk-forward. But that is a single test. The bigger lesson is that the signal choice swung the result by 36 points, which means you should not over-trust any single backtest. Whether MACD's edge holds up needs testing across more assets and regimes.
Q: Why did MACD do so much better in the same market?
Mainly responsiveness. The faster MACD settings flipped in time to catch SOL's sharp down-legs and counter-rallies, while Supertrend's ATR band lagged and got whipsawed. The parameter grid confirms it: fast settings were consistently positive, slow ones consistently negative.
Q: Can I just use the fast (9,19) parameters that made 81%?
That is the exact hindsight trap the walk-forward exists to avoid. The reassuring part is that the walk-forward independently kept selecting (9,19) out of sample, which is a better sign than cherry-picking. But past-best parameters are never guaranteed to be future-best, so size cautiously and keep validating.
Q: A 51% drawdown on a strategy that ended flat, is that worth it?
That is a personal risk question. Ending near $100k after dipping to roughly $48k is very different from a smooth ride, even though the final number looks calm. Many traders could not hold through that drawdown, which is why position sizing and lower leverage matter more than the headline return.
Q: Were the costs modelled the same as the Supertrend test?
Yes, identical: 0.04% LMEX taker fee plus 0.02% slippage per side, and the same real 8h funding history. MACD traded a bit more than Supertrend (21 versus 9 round trips), but on daily bars that is still low turnover, so costs were not the deciding factor.