Update 2: We Ran 10 Strategies Across Bitcoin, Solana and Nvidia. Here Is the Most Consistent One.
Across this series we have watched the same ten strategies win on one asset and lose on another. EMA crossover topped the SOL leaderboard at +48%, then came sixth on Bitcoin. That is entertaining, but it is not what a trader actually needs. A trader does not want the strategy that won one coin in hindsight. They want the strategy they can point at any market and trust. So we asked the harder question directly: of these ten strategies, which is the most consistent? To answer it we added a third and very different asset, and we changed what we were measuring.
The test: same window, three very different assets
We ran the identical ten strategies on three assets at once: SOL-PERP, BTC-PERP, and NVDA-PERP, the Nvidia equity perpetual listed on LMEX. Because NVDA-PERP is a newer listing, all three only share data from February 2026, so every strategy was tested on the exact same 162-day window on all three assets. That common window matters, and we will come back to why.
Notice we deliberately picked assets that did different things. Two drifted down, one rose. If a strategy is genuinely consistent, it should hold up across all three. If it only worked because one coin happened to trend cleanly, this test will expose it.
The consistency map
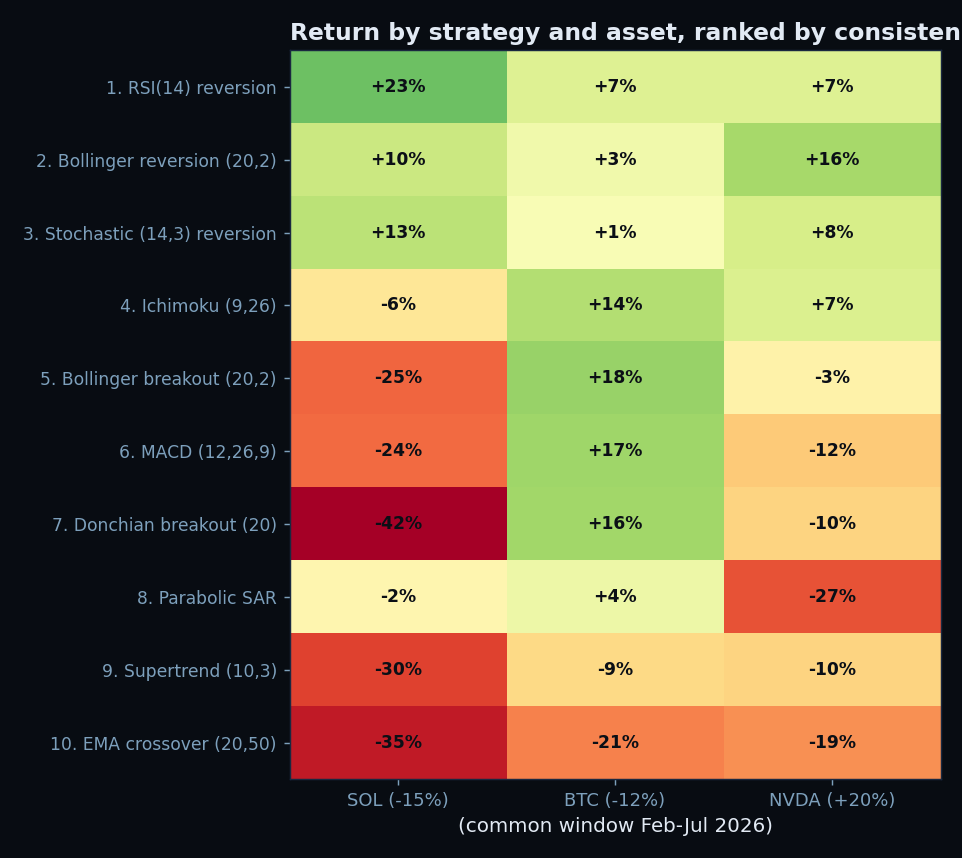
Instead of ranking by peak return on one asset, we ranked by how a strategy did across all three. Here is every strategy on every asset, sorted from most consistent to least.
The answer: RSI(14) reversion
If a trader made us name one strategy, it is RSI(14) reversion. It made money on all three assets, its worst result was still a +7% gain, and it posted the best average rank of the field. It never had a losing asset. In a test built specifically to punish strategies that only work in one place, it was the one that showed up everywhere.
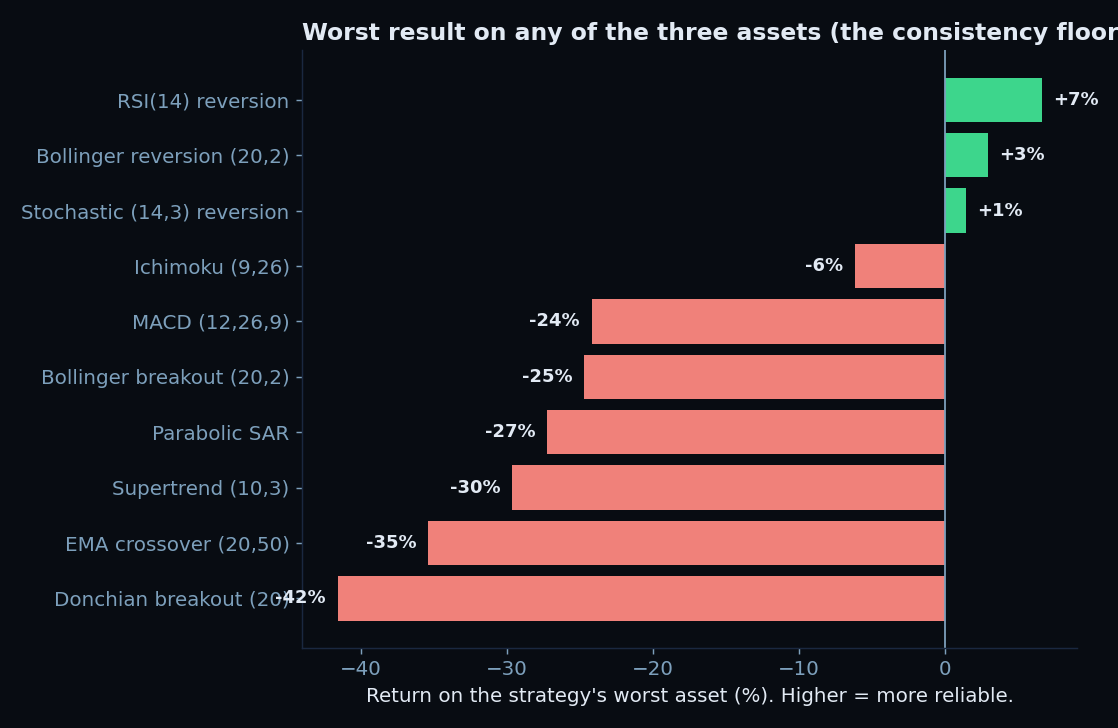
And it was not alone. The entire top three, RSI reversion, Bollinger reversion, and Stochastic reversion, are mean-reversion strategies, and all three were positive on all three assets. The single most useful consistency measure is the worst-case column: how badly did the strategy do on its worst asset? For the three reversion strategies, the worst case was a gain of +7%, +3%, and +1%. For every trend and momentum strategy, the worst case was a double-digit loss, as much as -42%.
The twist you should not skip
Here is where it gets interesting, and where a lazy reading would mislead you. This result is the exact opposite of what we found earlier in the series. In the SOL bear-market study, mean reversion finished at the bottom and trend following at the top. Now mean reversion sweeps the top and trend following sinks. Same strategies, same code, opposite conclusion.
The reason is the window, and it is the most important lesson in this entire series. The earlier articles covered the full ten months from September 2025, which contained long, clean, sustained downtrends. Clean trends are exactly what trend-following strategies are built to ride, so EMA crossover and friends thrived. This consistency test, forced by NVDA's shorter history to use February to July only, landed on a choppier, more range-bound stretch. SOL and BTC drifted sideways-to-down without committing, and NVDA ground upward through constant reversals. Choppy, mean-reverting markets are precisely where "buy the dip, sell the rip" wins and where trend followers get whipsawed to death.
So which strategy is really the most consistent?
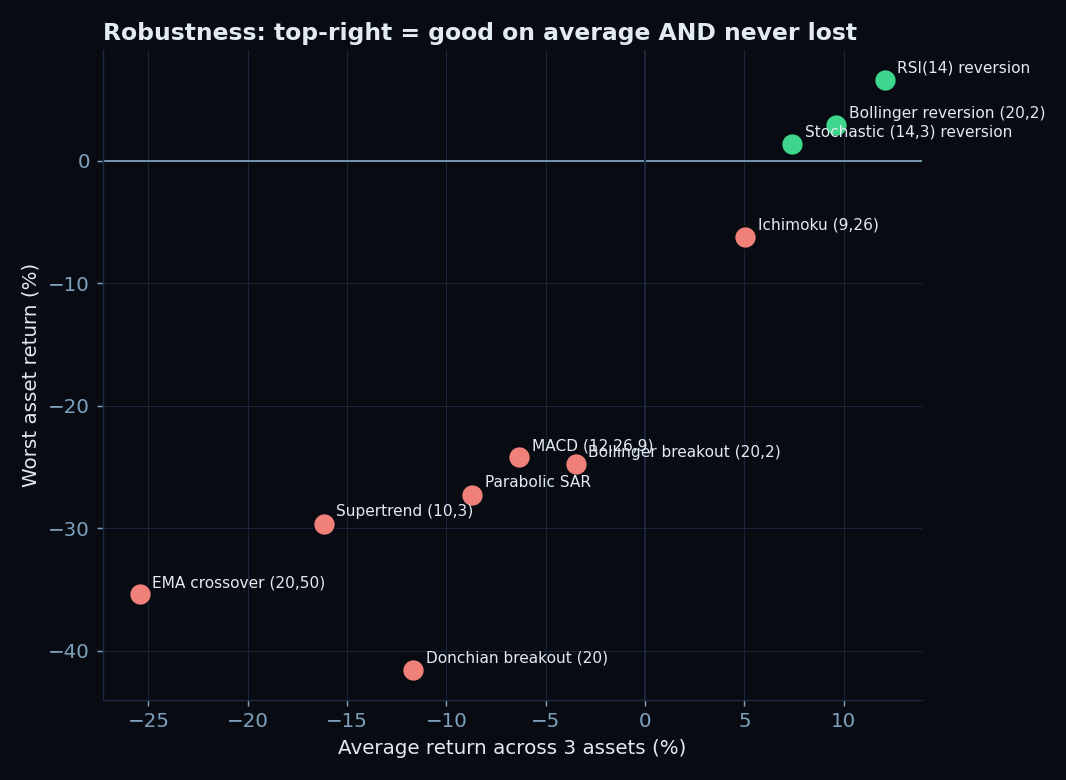
The honest answer has two layers. Across these three assets in this window, RSI(14) reversion was the most consistent, full stop. It made money everywhere and never had a bad market. If you want a single number to act on, that is it.
But consistency across assets is not the same as consistency across time. The strategy that was most consistent here was near the worst in the trending window, and the strategy that won the trending window was dead last here. No single strategy in our lineup was consistent across both regimes. That is not a failure of the test. It is the finding. Trend following and mean reversion are not competitors where one is simply better. They are opposite tools for opposite conditions. Trend following pays you in clean, committed moves and bleeds you in chop. Mean reversion pays you in chop and gets run over by clean trends.
The practical takeaway for a trader is therefore not "trade RSI reversion and nothing else." It is this: the most consistent portfolio is not the most consistent strategy, it is a pairing of a mean-reversion strategy and a trend-following strategy, because between them they cover both regimes. When one is bleeding, the other is usually earning. If you are going to run just one, run the one that matches the market you are actually in: mean reversion when price is ranging, trend following when it is trending. And keep testing, because the moment you assume a winner is permanent, the regime changes and proves you wrong. That has happened twice already in this series.
What Did We Learn?
First, the direct answer traders came for. Of the ten strategies, RSI(14) reversion was the most consistent. It made money on all three assets, SOL at +23%, BTC at +7%, and Nvidia at +7%, its worst result on any of them was still a +7% gain, and it posted the best average rank in the field. The whole mean-reversion family, RSI, Bollinger reversion, and Stochastic, filled the top three, each one positive on all three assets. If you want a single strategy that held up across a mixed basket of markets, that is the one the data points to.
Now the essential caveat, and the reason we did not simply crown it and stop. That result came from a choppy, range-bound window. In the earlier cleanly-trending SOL bear market, the very same RSI reversion sat near the bottom of the table while trend following won. The most consistent strategy is therefore conditional on the regime, which is the thread running through everything below.
Here is the whole series distilled: six tests, three assets, two regimes, ten strategies.
The meta-lesson underneath all of it: backtesting is not for finding the strategy that won. It is for measuring how much your result depends on the choices you made. Run many strategies, across many assets and many regimes, and trust only what survives all three. Everything else is just a line on a chart.
Frequently Asked Questions
Q: What is the single most consistent strategy of the ten?
RSI(14) reversion. Across SOL, BTC, and NVDA over the same window it made money on all three, with a worst case of +7% and the best average rank. The other two mean-reversion strategies, Bollinger reversion and Stochastic, took the next two spots, also positive on all three.
Q: Why does this contradict your earlier articles where mean reversion lost?
Because of the market regime, not the strategies. The earlier tests covered a cleanly trending decline that suited trend following. This consistency test, limited by NVDA's data to February onward, covered a choppier, range-bound window that suited mean reversion. The winner flips with the regime, which is the core lesson.
Q: Does that make the earlier conclusions wrong?
No, both are correct for their conditions. Trend following genuinely was best in the sustained-trend window, and mean reversion genuinely was best in the choppy window. The mistake would be to treat either result as universal. Neither is.
Q: So what should I actually trade?
The most robust approach is to run both a mean-reversion and a trend-following strategy, since they profit in opposite conditions and smooth each other out. If you insist on one, match it to the current regime and re-evaluate often. Consistency comes from covering both regimes, not from finding one perfect strategy.
Q: Is a 162-day window on three assets enough to be sure?
No, and that honesty is the point of the series. It is enough to demonstrate the method and to show clearly that the ranking depends on regime. Real confidence would need many assets across many years and market conditions. Treat RSI reversion's win here as a strong signal, not a law.