We Tested 10 Strategies in a Descending Market. What Does the Data Tell Us?
Between September 2025 and July 2026, SOL fell from $238 to $78. That is a 67% decline, one of the cleaner descending markets a crypto trader could be handed. It is also the perfect laboratory. When everything is going up, almost any long-biased strategy looks like genius. A falling market strips that flattery away and asks a harder question: with real money, real fees, and no hindsight, what actually works when the tide goes out?
So we ran the experiment properly. Ten strategies, one asset, a $100,000 account each, ten months of real LMEX daily data, and identical trading costs. No optimisation, no cherry-picking. This article is what the data said.
How the test was built
Every strategy played by the same rules, because the moment you tune each one to this specific data you are just measuring hindsight. Textbook parameters, identical costs, identical data.
Two of these strategies, Supertrend and MACD, got their own full deep dives earlier, with parameter sweeps and walk-forward tests. If you want the methodology in detail, start with the Supertrend study and the MACD head-to-head. Here we care about the whole field at once.
The leaderboard
Now the findings, in order of how much they should change your thinking.
Finding 1: every strategy beat buy and hold
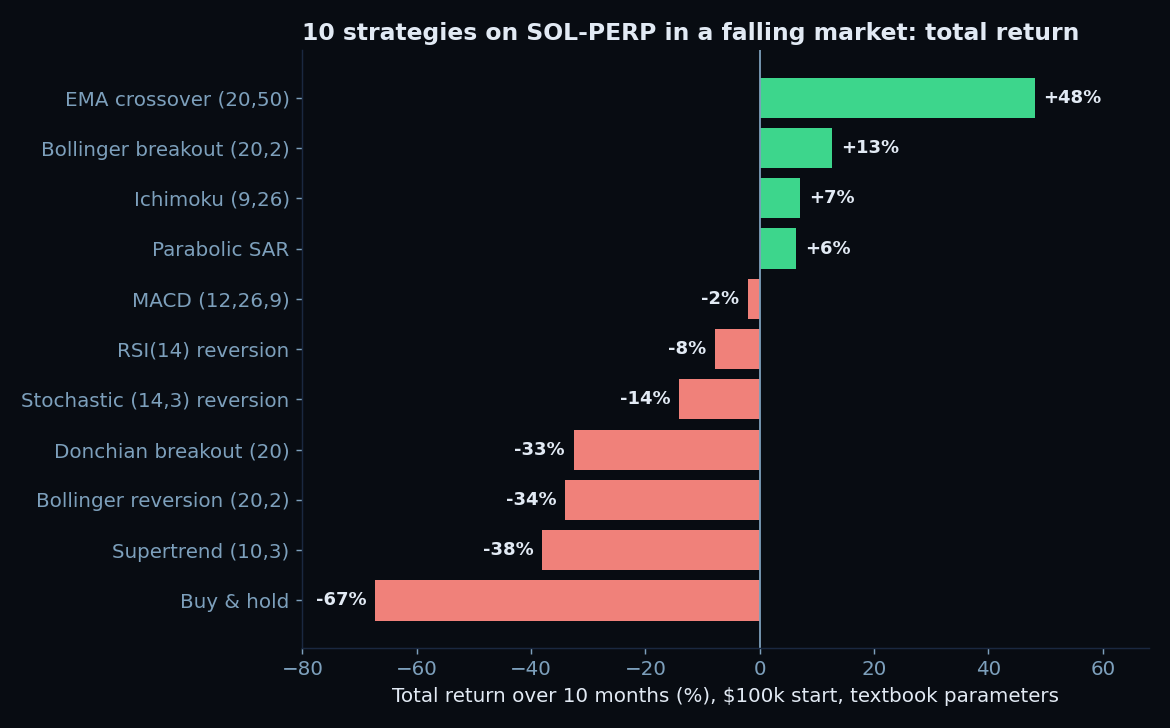
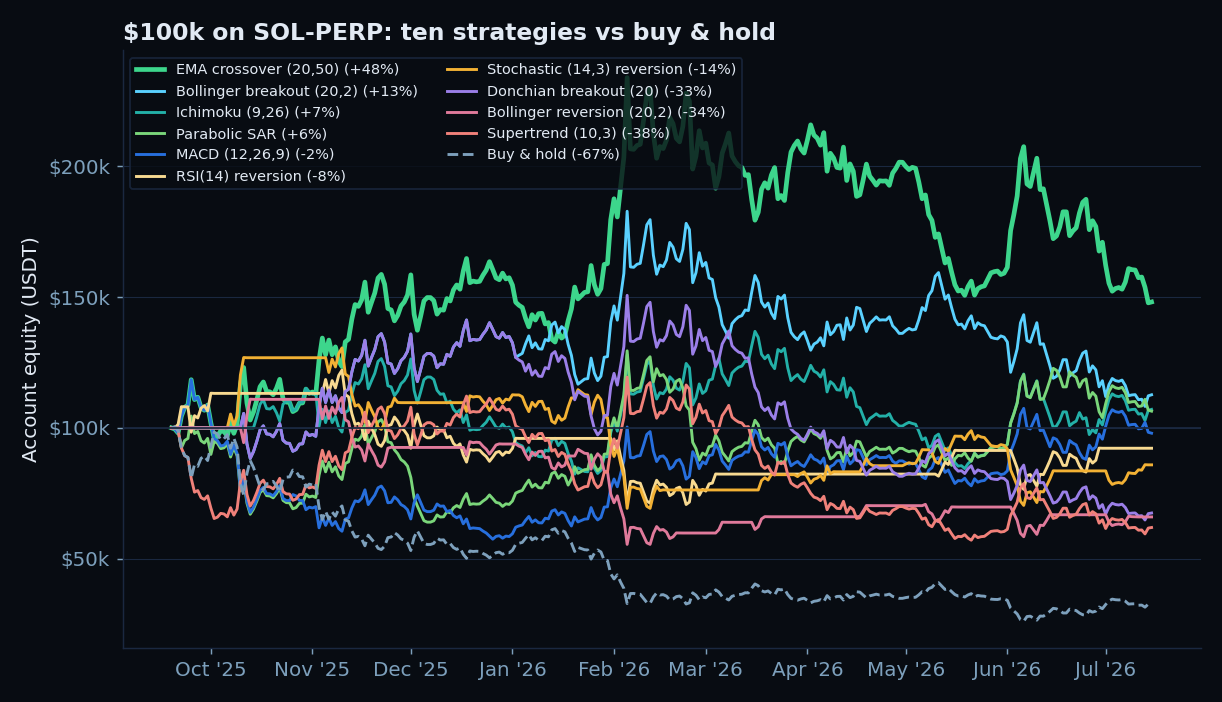
All ten systematic strategies, including the four that lost money, finished ahead of simply holding SOL. The worst strategy, Supertrend at -38%, still ended with nearly double the capital of buy-and-hold at -67%. In a sustained downtrend, the single most valuable thing a strategy did was not being a genius. It was having an exit, or the ability to go short, so it did not ride the full decline to the bottom. If you take nothing else from this, take that: in a bear market, a rule that gets you out or flips you short beats conviction every time.
Finding 2: being systematic was not enough to profit
Beating buy-and-hold is a low bar. Only four of the ten strategies actually made money: EMA crossover, Bollinger breakout, Ichimoku, and Parabolic SAR. The other six lost, some of them badly. So the comforting story that "quant strategies protect you in bear markets" is only half true. They mostly protected capital relative to holding, but making a positive return while the underlying fell 67% was the exception, not the rule, and it took the right strategy to do it.
Finding 3: same family, opposite outcomes
Here is the finding that should make you distrust every strategy taxonomy you have read. Trend and momentum strategies took the top four spots. They also took the bottom two among the strategies, Supertrend and Donchian. The same broad family, "follow the trend," produced both the +48% winner and the -38% and -33% losers. An 86 percentage point spread inside one strategy family.
The winner, a plain 20/50 EMA crossover, is the simplest idea in the entire lineup: go long when the fast average is over the slow one, short when it is under. It traded only eight times, stayed short through the big down-legs, and posted a profit factor of 3.81. Supertrend and Donchian chase price more aggressively, and in a choppy decline full of vicious counter-rallies they kept flipping at the worst moments. Same philosophy, opposite outcome. The label "trend following" told you almost nothing about how these would perform. The specific mechanics told you everything.
Finding 4: the rule mattered more than the indicator
The cleanest illustration of that point is Bollinger Bands, which appear twice in the lineup. Run as a breakout strategy, buying when price pushes above the upper band, it returned +12.7% and finished second. Run as a reversion strategy on the identical bands, fading price back toward the middle, it returned -34% and finished near the bottom. Same indicator, same 20-period, 2-standard-deviation bands, opposite trading rule, and a 47 point gap in the result. The indicator was never the strategy. What you did with it was.
Finding 5: mean reversion caught the falling knife
All three mean-reversion strategies lost money: RSI at -8%, Stochastic at -14%, Bollinger reversion at -34%. This happened despite a choppy market that should, in theory, suit reversion. The reason shows up in the win rates. RSI and Stochastic both won 67% of their trades, the highest in the field, and still lost, because their profit factors sat below or near 1.0. They booked many small wins buying dips, then gave it all back when a dip kept dipping. In a market making persistent new lows, "buy oversold" is a machine for catching falling knives. A high win rate with a low profit factor is one of the most seductive traps in trading, and this is what it looks like in the wild.
Finding 6: nobody escaped the pain
Return is only half the picture. Look at the drawdowns.
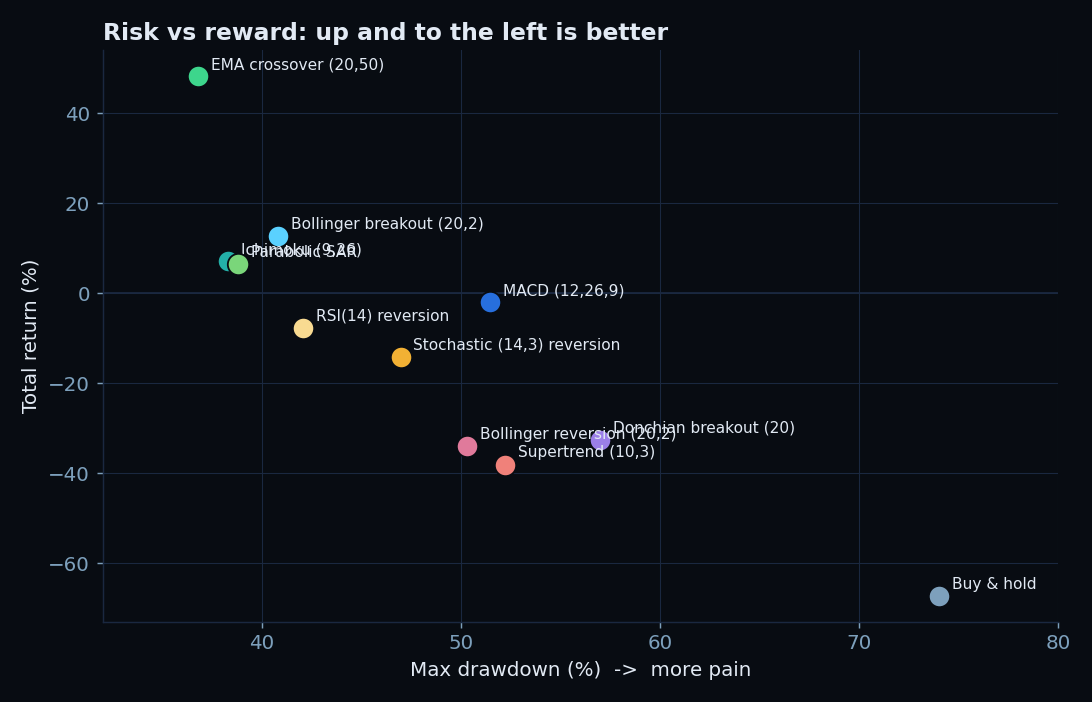
Even the +48% winner spent time 37% underwater. Every strategy in the study drew down between 37% and 57% at its worst. There was no smooth path to profit anywhere on this board. Ending the year at $148k felt very different in February, when the same account had given back more than a third of its value. A backtest that finishes green tells you nothing about whether you could have psychologically held it through the red, and the math of drawdown recovery is brutal about what climbing out of a 50% hole requires.
What the data actually tells us
Step back from the individual names and look at the shape of the result. Ten reasonable strategies, run honestly on the same data, ranged from +48% to -38%. That spread is the real finding, and it is worth more than any single row in the table.
It tells us that a single backtest of a single strategy is close to worthless as evidence. If your entire outcome swings 86 points depending on which strategy you happened to pick, then the result is a story about that choice, not a discovered truth about SOL or about trend following. The honest way to use backtesting is exactly this exercise: run many strategies, look at the whole distribution, and treat any lone green equity curve with deep suspicion. The value was never in finding the winner. It was in seeing how wide the range of outcomes really is.
It also tells us, gently, what tended to travel well in this particular descending market: simple, slower trend and momentum systems that could go short, held through fewer trades, and did not try to be clever. EMA crossover, Bollinger breakout, Ichimoku, and Parabolic SAR all share that DNA. That is a hypothesis worth carrying forward, not a conclusion.
What the data does not tell us
This is one asset over one ten-month descending regime. That is the single largest caveat, and it applies to every number above. The EMA crossover won on eight trades, a small enough sample that luck is a real component. In a bull market, the mean-reversion strategies that failed here might shine, and the shorting-heavy trend systems might give back their edge. Nothing here proves any strategy has a durable edge. It shows how a fixed set of strategies behaved on one slice of history.
The only way to turn this from an interesting chart into a trustworthy conclusion is to repeat it: run the identical ten-strategy shootout on BTC-PERP, on ETH, and across bull, bear, and ranging periods. A strategy that ranks near the top across many of those tests is worth your capital. A strategy that won once, on one coin, in one falling market, is a line on a chart. Build the backtesting discipline to know the difference, and never let a single result, including this one, make the decision for you.
Frequently Asked Questions
Q: What was the best strategy?
On SOL-PERP over these ten falling months with textbook parameters, the 20/50 EMA crossover won clearly at +48%. But "best on one asset in one bear market" is not "best in general." The huge spread across strategies is a warning that the result is specific to this test. Trust a strategy only after it ranks well across multiple assets and market regimes.
Q: Why did simple strategies beat sophisticated ones?
In this market, the simpler trend systems traded less and got whipsawed less. EMA crossover made 8 trades and stayed short through the major declines, while more reactive systems like Supertrend flipped repeatedly during counter-trend rallies and lost. Simplicity and low turnover were advantages here, though that will not hold in every regime.
Q: Why did mean reversion lose in a choppy market?
Because the chop happened around a strong downtrend. Buying oversold conditions repeatedly bought into further declines. The high win rates of RSI and Stochastic, both 67%, hid the problem: small frequent wins were wiped out by a few large losses, giving profit factors below 1.0. That is the classic failure mode of reversion in a trending market.
Q: Did you optimise the parameters?
Deliberately not. Every strategy used its standard textbook settings. Optimising each one to this exact data would have produced flattering, meaningless results. Standard parameters are the only fair way to compare strategies without cherry-picking, and it keeps the whole exercise honest.
Q: Would these rankings hold on Bitcoin or in a bull market?
Unknown, and that is the entire point. This is one asset in one descending regime. The logical next step is to run the identical test on BTC-PERP and across different market conditions. Only strategies that stay near the top across many such tests should be considered to have a real edge.