Update 1: We Ran the Same 10 Strategies on Bitcoin. The SOL Winner Came Sixth.
Every article in this backtest series ended with the same warning: a result on one asset proves nothing until it repeats on another. We said it about Supertrend, about MACD, and loudest of all in the ten-strategy shootout on SOL, where a plain EMA crossover won convincingly with +48%. So we did the honest thing and ran the identical ten strategies, same parameters, same costs, same method, on a completely different asset: BTC-PERP. The result is the most important test in the whole series, because it tells us how much of what we learned on SOL was real and how much was luck.
Same test, different coin
Nothing changed except the market. Same ten strategies, same textbook parameters, same $100k, same fee and funding model. Only the price data is different, and BTC's descent over the window was milder than SOL's.
The Bitcoin leaderboard
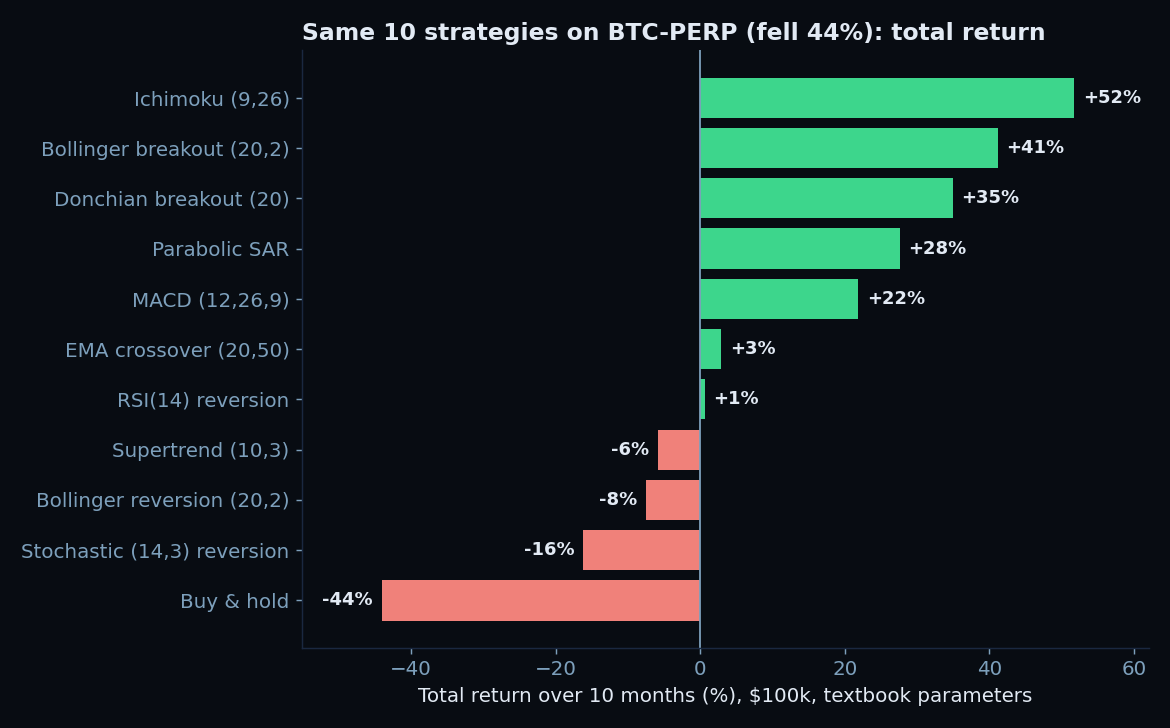
Straight away, two things differ from SOL. Seven of ten strategies made money on BTC, versus only four on SOL, and the drawdowns were far gentler, mostly in the 20% to 34% range instead of SOL's 37% to 57%. BTC fell less and fell more smoothly, and a smoother trend is exactly what trend and momentum systems want. But the interesting part is not the individual numbers. It is what happened to the ranking.
The winner changed
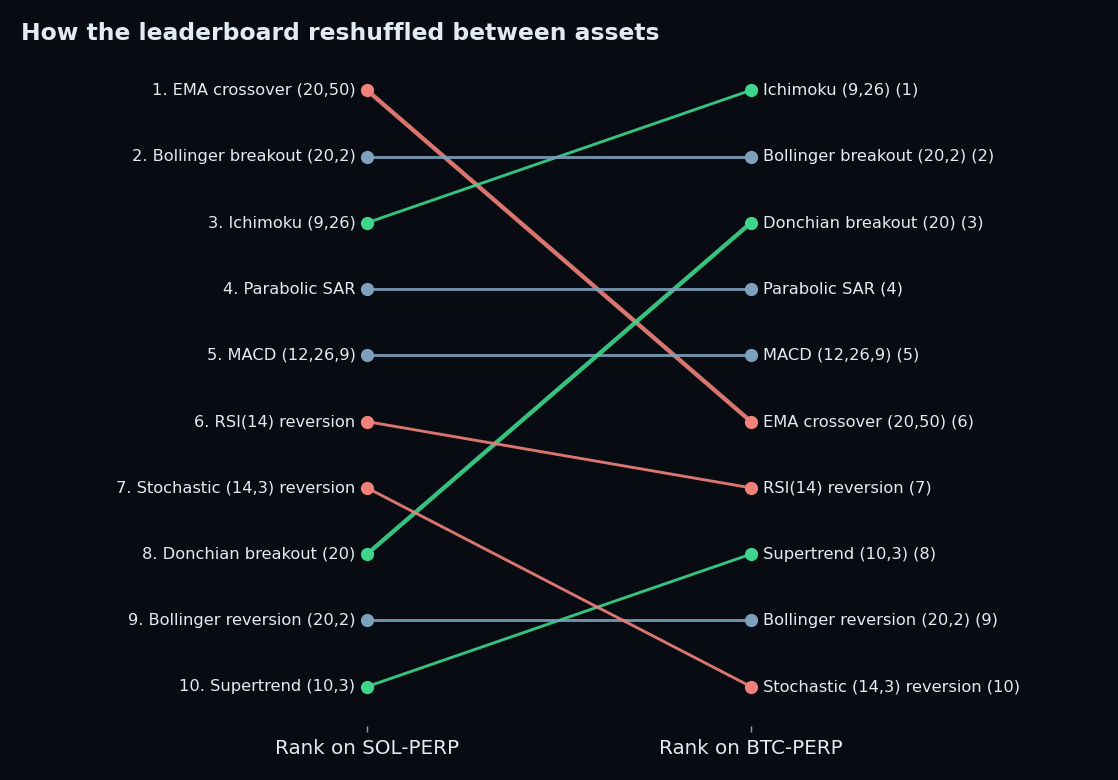
On SOL, the EMA crossover was the clear champion at +48%. On BTC, that same strategy with the same parameters returned +2.9% and finished sixth. The best strategy on one asset was a middling also-ran on another. If you had read the SOL article, concluded "EMA crossover is the answer," and pointed it at Bitcoin, you would have earned almost nothing while five other strategies made double-digit returns.
Meanwhile the strategy that won Bitcoin, Ichimoku at +51.7%, had finished a modest third on SOL at +7%. And Donchian breakout, which was nearly the worst strategy on SOL at -33% and tenth of ten, jumped to third on BTC at +35%. The leaderboard did not just wobble. It reshuffled.
But not everything moved
Here is the part that actually matters, and it is easy to miss in the drama of EMA crossover falling from first to sixth. Some strategies barely moved at all. Bollinger breakout finished second on both assets. Parabolic SAR finished fourth on both. MACD finished fifth on both. Bollinger reversion finished ninth on both. These strategies held their position across two very different coins, which is a far stronger signal than winning once.
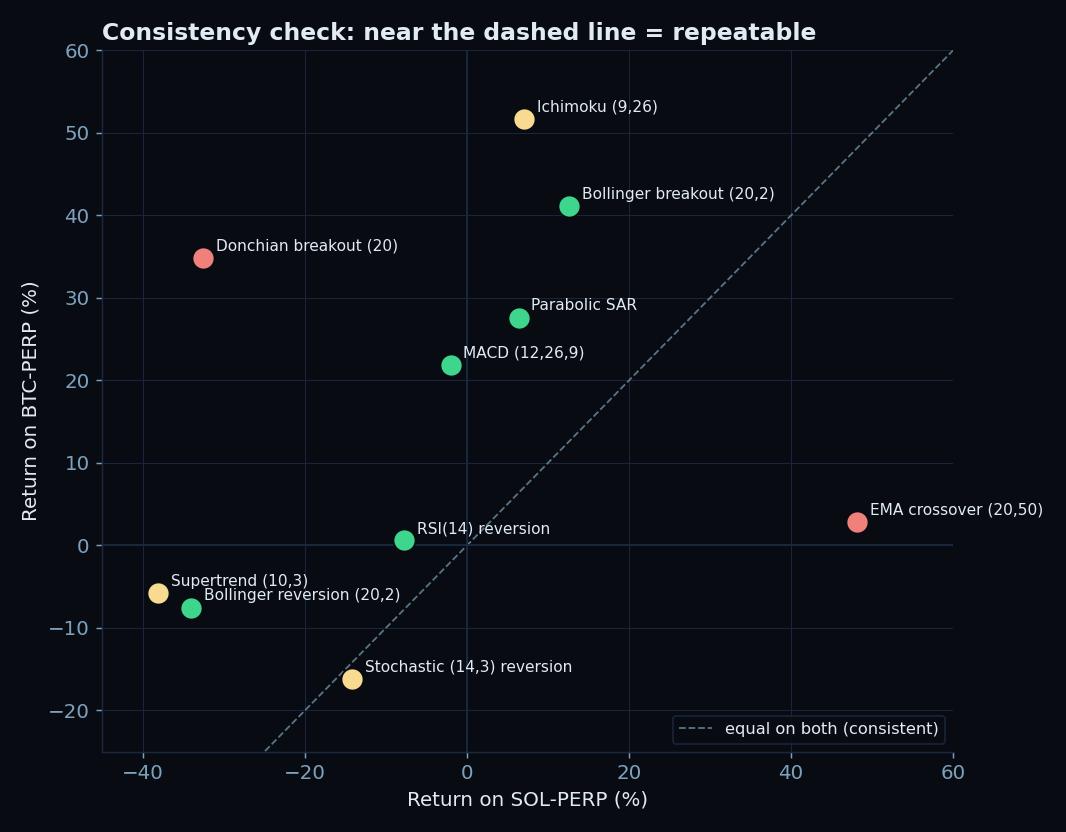
This is the whole lesson of the series made visible. The strategies clustered near the diagonal, Bollinger breakout, Parabolic SAR, MACD, did roughly the same thing on both coins. The strategies far from it, EMA crossover high on SOL but flat on BTC, Donchian low on SOL but high on BTC, were riding asset-specific quirks. When you are choosing a strategy to trade real money, the ones near the diagonal are the ones worth trusting, precisely because they did not depend on which coin you happened to test.
What repeated across both assets
Strip away the reshuffling and a few findings survived the change of asset, which makes them the most trustworthy conclusions in the entire series.
Every single strategy beat buy-and-hold on both coins. On BTC the worst strategy lost 16% while holding lost 44%. On SOL the worst lost 38% while holding lost 67%. Across twenty strategy-runs on two assets, not one failed to beat buy-and-hold in a falling market. That is the closest thing to a robust result we found.
Mean reversion struggled on both. Bollinger reversion and Stochastic finished in the bottom three on both assets. Buying oversold conditions into a downtrend is a losing game whether the downtrend is Bitcoin's or Solana's. RSI was the one reversion strategy that stayed near breakeven, but none of the three profited meaningfully on either coin.
The momentum and breakout family did well when the trend was clean. On the smoother BTC decline, Ichimoku, Bollinger breakout, and Donchian took the top three. On the choppier SOL decline, only Bollinger breakout among the breakout systems thrived. The lesson is not "breakouts are good," it is "breakouts need a clean trend to break into," and BTC provided one while SOL did not.
What this means for how you use backtests
The replication delivered exactly the verdict the series kept predicting. A backtest on a single asset does not generalise. The SOL champion came sixth on Bitcoin. If we had stopped at one coin and published "EMA crossover is the best strategy," we would have been confidently, measurably wrong. It took a second asset to expose that, and it would take a third, a fourth, and several market regimes to build real confidence in any of these strategies.
What survives replication is what you should trust. The strategies that held their rank across two very different coins, and the findings that repeated on both, are worth more than the highest single number on either leaderboard. Consistency across tests is the signal. A lone impressive backtest is noise wearing a suit. Build the backtesting discipline to run the second test, and the third, before you believe the first.
Two assets is better than one, and still not enough. But the method now has teeth: run the same honest test across many markets, keep the strategies that stay near the top, and discard the ones that only shone once. That is the difference between a backtest that flatters you and one that informs you.
Frequently Asked Questions
Q: Why did the SOL winner do so badly on Bitcoin?
The EMA crossover thrived on SOL's specific price path, staying short through its big clean down-legs. BTC's decline was milder and shaped differently, so the same slow crossover caught less of it and got clipped by rebounds. Nothing about the strategy changed. The market did, and that was enough to drop it from first to sixth.
Q: Which strategies should I actually trust, then?
The ones that held their rank across both assets: Bollinger breakout, Parabolic SAR, and MACD each finished in the same position on both coins. Consistency across different markets is a much stronger signal than a single high return. But even two assets is a small sample, so treat these as promising, not proven.
Q: Why did more strategies profit on BTC than on SOL?
BTC fell less, 44% versus 67%, and more smoothly. Trend and momentum strategies need a sustained, clean move to profit from, and BTC's decline offered that while SOL's choppier drop full of sharp counter-rallies kept whipsawing them. The environment, not the strategies, explains most of the difference.
Q: Does any of this predict a bull market?
No. Both tests were descending markets, so every conclusion here is conditional on a falling price. Mean reversion that failed catching knives in a downtrend could look very different in a range, and shorting-heavy trend systems could give back their edge in a sustained rally. Bull and ranging regimes are the next tests, not something this data answers.