We Backtested Six Strategies on SOL-PERP with $100k. The Full Leaderboard.
This is the third piece in a series. First we ran Supertrend on SOL-PERP and it lost 38%. Then we ran MACD on the same data and it nearly broke even, which taught us that the choice of signal mattered more than the choice of asset. The obvious next question: if two strategies differ that much, what does the whole field look like? So we lined up six strategies, gave each the same $100,000 and the same ten months of SOL-PERP data, and ran them head to head. The spread in results is the most important thing in this article.
The rules of the shootout
To keep this fair, we made one firm decision: every strategy uses its standard textbook parameters. We did not optimise any of them. Optimising each strategy to this exact data would just be six separate versions of the overfitting trap the earlier articles warned about, and the winner would be meaningless. Textbook defaults, identical costs, identical data. May the best default win.
The leaderboard
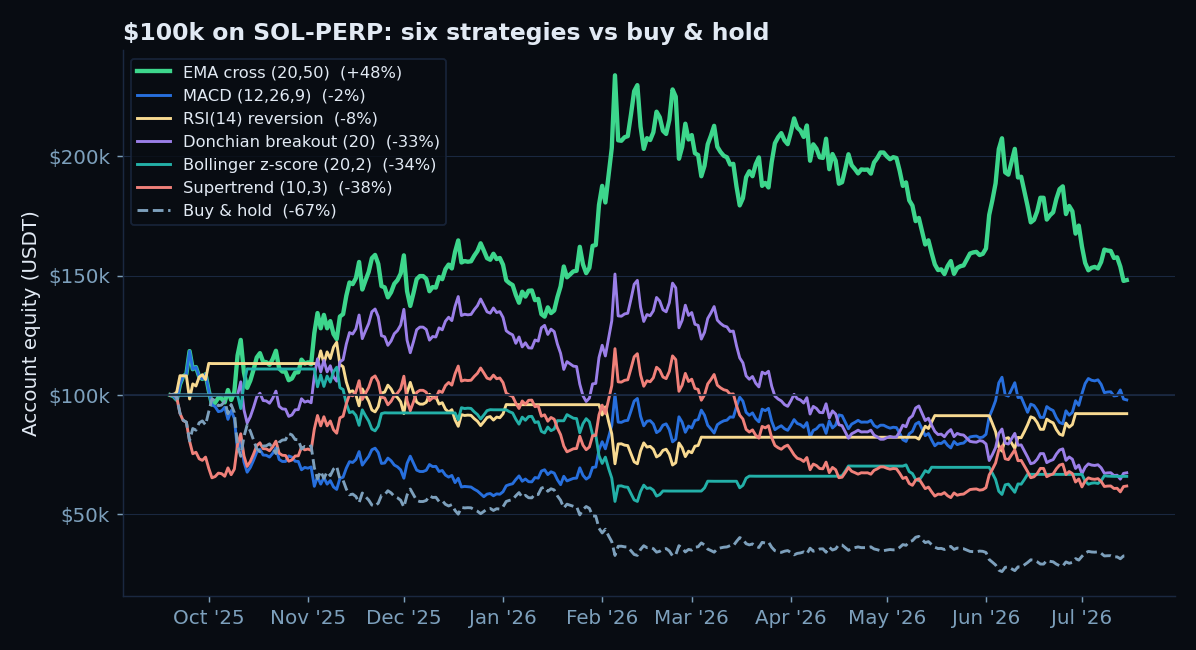
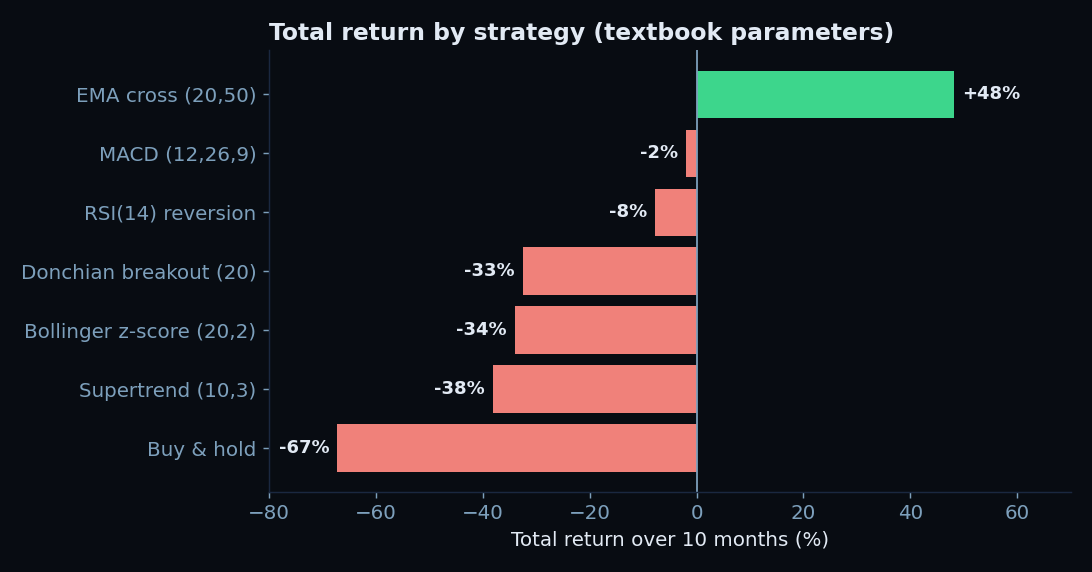
Three things jump out immediately.
Finding 1: everything beat buy and hold
Every single systematic strategy, even the worst one, beat holding SOL. The gap is enormous: the losing strategies ended between $62k and $97k, while buy-and-hold ended at $33k. In a sustained bear market, the simple ability to go short, or at least to step aside, was worth more than any clever signal. This is the least surprising result and the most reliable one. If you are going to hold a falling asset with no exit rule, a coin flip with a stop would likely have served you better.
Finding 2: "trend following" is not one thing
This is the finding that should change how you read backtests. Four of our six strategies are trend or momentum followers. They did not cluster together. EMA crossover returned +48%. Supertrend returned -38%. Donchian breakout returned -32%. These are all "buy strength, sell weakness" strategies, and they landed 86 percentage points apart on identical data.
The winner, a plain 20/50 EMA crossover, is almost embarrassingly simple: go long when the fast average is above the slow one, short when it is below. It traded only 8 times, caught the major down-legs by staying short, and posted a profit factor of 3.81, meaning its winners were nearly four times its losers. Supertrend and Donchian, by contrast, flipped at the wrong moments during counter-trend rallies and bled. Same idea, wildly different execution, wildly different result. Our EMA crossover guide covers why the slow, boring version often travels best.
Finding 3: mean reversion did not save the day
The market was choppy, which in theory should suit mean reversion. It did not deliver. Bollinger z-score reversion lost 34%, and RSI(14) reversion lost 8%. The RSI result is instructive: it won 67% of its trades, the highest win rate in the field, yet still lost money, because its profit factor was 0.85. It took many small wins and a few large losses, which is the classic way mean reversion dies. It also sat in cash 56% of the time, so it simply was not in the market enough to matter. Fading extremes in a market that keeps making new lows is a good way to catch a falling knife repeatedly.
The risk you are signing up for
Return is only half the story. Look at the drawdowns.
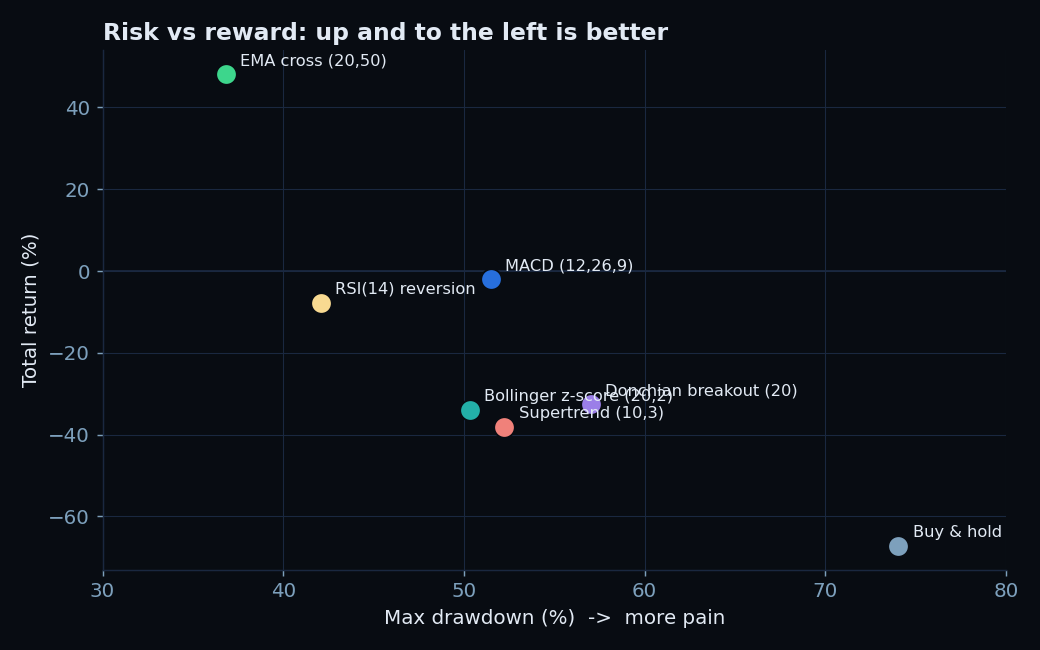
Even the +48% winner suffered a 37% drawdown along the way. The rest were worse, between 42% and 57% underwater at their lows. There is no strategy here that made money smoothly. Every one of them would have tested your conviction hard, and the math of drawdown recovery is unforgiving about what it takes to climb back from a 50% hole. A backtest that ends green tells you nothing about whether you could have held it through the red.
The real lesson: the spread is the message
Step back from the individual numbers. Six reasonable strategies, run properly on the same data with honest costs and no optimisation, produced results ranging from +48% to -38%. That 86-point spread is the single most important output of this entire exercise, and it is not a number any of the individual backtests would have told you on its own.
It means this: a single backtest of a single strategy is close to worthless as evidence. If picking EMA crossover over Supertrend swings your outcome by 86 points, then your result is dominated by that choice, not by any deep truth about SOL or trend following. The honest way to use backtests is exactly what we did here, run many of them, look at the distribution, and be suspicious of any single winner. The EMA crossover won this round. That does not mean it wins next year, or on BTC, or in a bull market. It means it fit this one price path best, and small samples of 8 to 11 trades leave plenty of room for luck.
The next step in this series is the one that actually matters: run the same shootout on other assets and other time periods. A strategy that wins consistently across many of those is worth trusting. A strategy that wins once, on one coin, in one bear market, is just a line on a chart. Build the backtesting discipline to tell the difference, and never let a single green equity curve make the decision for you.
Frequently Asked Questions
Q: Which strategy is the best?
On SOL-PERP over these ten months with textbook parameters, the 20/50 EMA crossover won clearly at +48%. But "best on one asset in one bear market" is not "best." The 86-point spread across strategies is a warning that the result depends heavily on the specific test. Trust a strategy only after it wins across multiple assets and regimes.
Q: Why did the simple EMA crossover beat fancier trend systems?
Mostly because it was slow and traded little. It stayed short through the major down-legs and did not get whipsawed by counter-trend rallies the way the faster, more reactive Supertrend and Donchian systems did. Simplicity and low turnover were assets in this particular market, though 8 trades is a small sample.
Q: Why did you not optimise each strategy?
Because optimising each one to this exact data would guarantee flattering results and teach nothing. Using standard textbook parameters is the only fair way to compare strategies without cherry-picking, and it keeps the comparison honest.
Q: Did any strategy make money safely?
No. Even the +48% winner drew down 37% along the way, and the others were deeper. Every strategy here required sitting through a painful drawdown. Position sizing and leverage discipline matter more than the headline return, because most people cannot hold a strategy through a 40% loss.
Q: Would these results hold on another coin?
Unknown, and that is the point. This is one asset over one regime. The logical next test is to run the identical shootout on BTC-PERP and other markets and see whether the same strategies rank highly. Consistency across tests is the only real evidence of an edge.